The geographical dimension of the productivity problem
Ron Martin is Principal Investigator of the ESRC-funded project Structural Transformation, Adaptability and City Economic Evolutions. This article is reposted from Cambridge Econometrics.

In his budget speech (24 November, 2017), the Chancellor of the Exchequer made much of the need to raise national productivity.
Since 2007, and the onset of the financial crisis, productivity growth in the UK economy has stalled, compared to both the national trend over the ‘long boom’ of 1993-2007 and to the performance of most of our major international competitors. Nor is the prospect any better: the Office for Budget Responsibility forecasts that productivity growth will remain sluggish over the next five years.
The causes of the stagnation of British productivity growth are much debated, with explanations ranging from a lack of investment by the private sector, to a low rate of R&D by firms, to inadequate infrastructure, to an insufficiently skilled workforce.
One key aspect of the ‘puzzle’, however, has not received as much attention – or policy response – as it deserves, namely the geographical dimension of the productivity slowdown.
While Southern Cities Recover, Northern Cities Stagnate
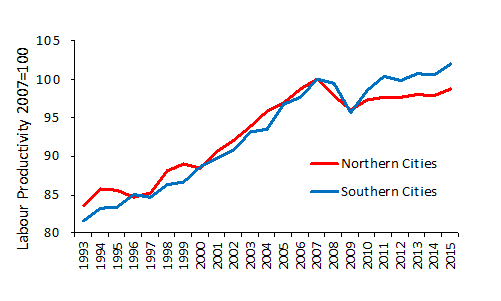
While productivity growth has slowed almost everywhere across the UK, there has been a significant difference between northern and southern cities. Both sets of cities witnessed a similar fall in labour productivity (gross value added per employed worker) between 2007 and 2009, but while productivity in southern cities has since recovered to pre-crisis levels – albeit to a slower rate of growth compared to the pre-crisis trend – that in northern cities has shown no such recovery (Figure 1).
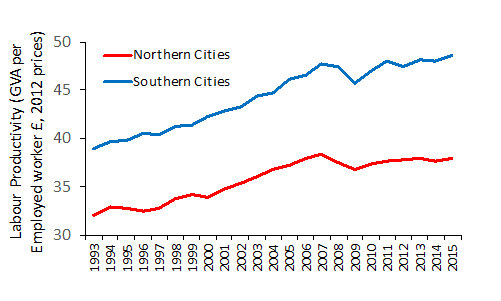
As a consequence, what in fact has been a longstanding disparity in labour productivity between these two groups of cities has widened further (Figure 2). In 1993 labour productivity in the northern cities averaged £32,100, compared to £39,700 in southern cities, that is a lead of southern cities over northern of around £7,600 per worker. In 2015, the corresponding figures were £37,900 and £48,600 respectively, an increase in the differential to about £10,700 per worker.
Figure 1: The Differential Post-Crisis Recovery of Labour Productivity in Southern and Northern Cities (Indexed 2007=100)
 Note: Data are for 85 cities, defined in terms of travel-to-work areas. Of these, 45 are in the ‘North’ and 40 in the ‘South’. The ‘South’ is defined as London, the South East, South West, East of England and the East Midlands regions. The ‘North’ includes the West Midlands, Yorkshire-Humberside, the North East, North West, Scotland and Wales. Labour productivity in 2012 prices, indexed to 2007=100. The data are those constructed as part of an ESRC-funded project on City Economic Evolutions (https://www.cityevolutions.org.uk).
Figure 2. The Productivity Gap between Southern and Northern Cities

An International Downward Trend
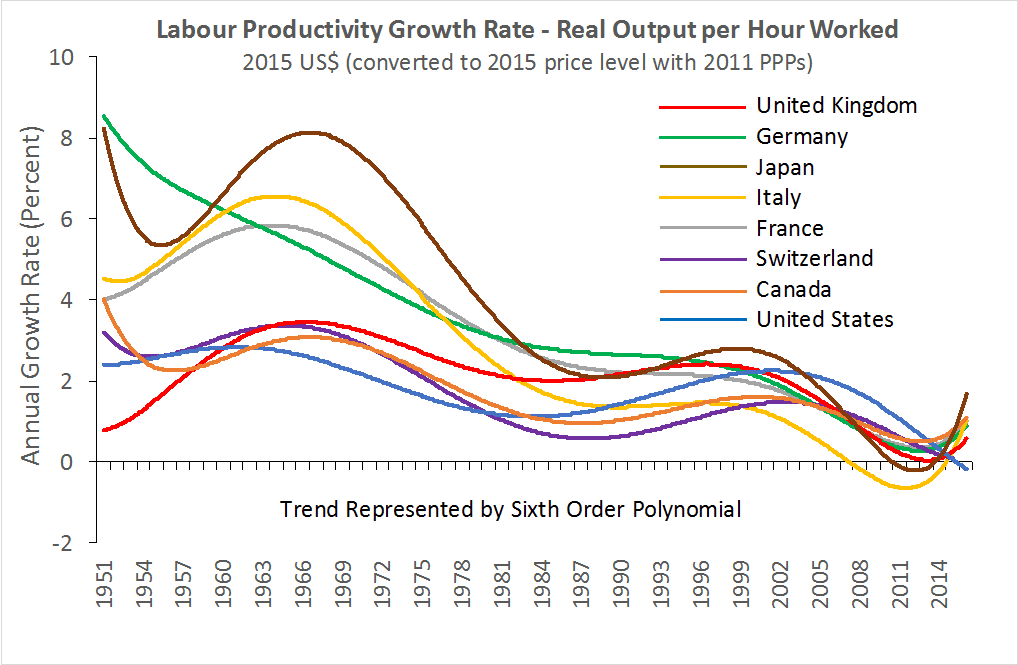
The problem is even more worrying than this, however. There has been some lively discussion amongst economists in recent years over what appears to be a long-run problem in labour productivity across most advanced economies. Allowing for cyclical movements, most of these economies, the UK among them, have experienced a steady downward trend in the rate of productivity growth since around the early-1970s (Figure 3).
Various explanations have been advanced to explain this phenomenon. For example, some argue that it is basically a measurement problem, in that the structural shift over the past forty years or so from an industrial mode of economic growth to one based mainly on services has led to an underestimation of productivity advance because it is difficult to measure in many service activities.
Others, however, contend that the negative effect of the shift to services is real, in that many services, especially of a personal and performative kind, have far more limited scope for productivity growth than found in manufacturing.
Yet others maintain that technological advances no longer confer the productivity gains they once did in the past. And still others point to a decline in investment and capital formation, including in investment in public infrastructures, as a proportion of GDP, as having had a dampening effect on productivity growth in the economy.
Figure 3: Long-run Trends in the Rate of Labour Productivity Growth in Leading Economies

Note: Calculated from the Conference Board Total Data Base (Productivity converted to 2015 US$, 2011 PPP). Labour productivity measured as GDP per person employed. A sixth-order polynomial in time gives the best-fit statistical trend for most of the countries shown.
A Complex Picture in the UK
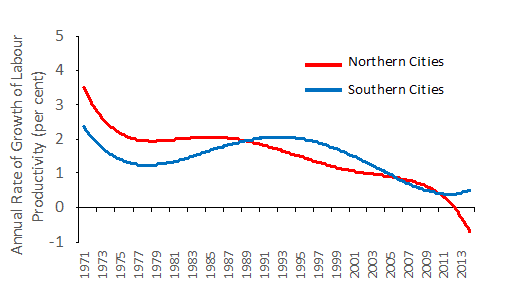
While these debates continue, the long-run slowdown in the rate of productivity growth in the UK has again displayed a distinct, and shifting, geographical pattern (Figure 4). During the 1970s, the trend rate of productivity growth fell in both southern and northern cities, but was nevertheless higher in the former than in the latter. In this period northern cities had, on average, a greater proportion of their economic activity in manufacturing than was the case in southern cities.
By the mid-1980s, northern cities had lost a large share of manufacturing through deindustrialisation, while southern cites had begun to see more rapid growth in services, and especially knowledge-based services. Thus, while productivity growth in northern cities languished it improved in cities in the south of the country, overtaking that in the northern group.
But from the mid-1990s onwards, both groups of cities experienced a decline in the trend rate of productivity growth. In the post-crisis period the trend rate of productivity growth has recovered slightly in southern cities, but not in northern ones (as is consistent with the patterns in Figure 1).
Figure 4: Long-run Trends in the Rate of Productivity Growth in Southern and Northern Cities.

What seems clear is that, first, the national puzzle of slow productivity growth has a distinct and significant geographical dimension, in that growth has stagnated much more in northern cities than in southern. While growth has recently recovered in the southern cities, albeit at a slower rate than prior to the crisis, in northern cities there has been virtually no recovery at all.
Second, the national productivity growth problem is arguably of much longer standing than just the period since 2007: allowing for cyclical fluctuations, the rate productivity advance has been on a long run downward path since the early-1970s.
Third, this long-run slowdown has been particularly evident in northern cities: as they have lost their manufacturing base, so their rate of productivity growth has slowly fallen. Even in the more service-based southern cities, productivity growth slowed after the mid-1990s.
The Government’s Industrial Strategy May Exacerbate the Divide
These patterns obviously have a relevance for policies aimed at lifting the national rate of productivity growth. The Government’s just-published lengthy Industrial Strategy: Building a Britain Fit for the Future claims to set out a new strategic path to improved productivity. There is much in this document about the need to promote and support leading technologies and sectors (such as life sciences, artificial intelligence, clean energy), but by comparison not that much about the challenge of raising productivity in northern cities and regions. The main means by which the national strategy is to involve a place-based dimension is to be via local industrial strategies emanating from individual cities and sub-regions.
There is no overall clear or well-funded strategy committed to spatially rebalancing the economy. Indeed, it is likely that the result will be to strengthen yet further those cities and sub-regions that already have a head start in the sectors and technologies singled out for special attention, most of which are in fact in southern England, and especially in the ‘golden triangle’ of London-Cambridge-Oxford. The benefits for most northern cities of the new industrial strategy appear to be limited.