Monitoring CO2 Emissions in China’s Cities
In this blog Dabo Guan, Principal Investigator of the ESRC-funded project Euro-China GE: Dynamics of Green Growth in European and Chinese Cities (DRAGON), discusses some of the findings of the China Emission Accounts and Dataset (CEADs) – a multidisciplinary, international collaboration working to develop a comprehensive picture of the country’s urban emissions.
 China Emission Accounts and Datasets (CEADs) gathers a group of experts from the UK, USA and China to work on China’s emission accounting methods and applications. Together, they provide accurate and up-to-date energy, emission and socioeconomic accounting inventories for China across the whole academic field for policy stakeholders and the public.
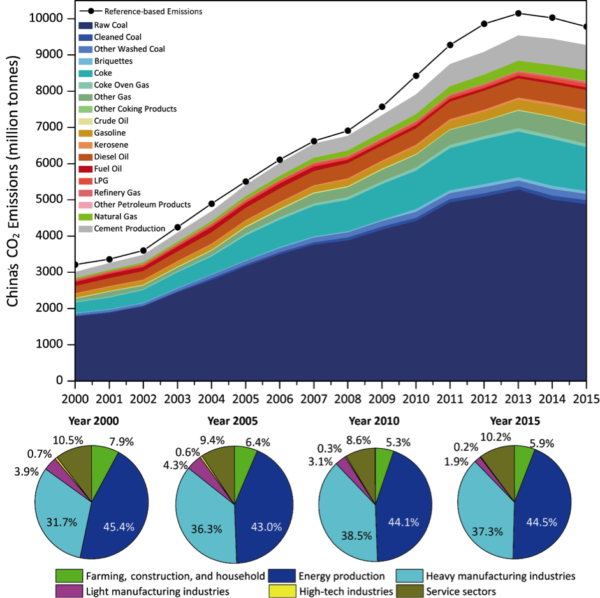
We now provide the Energy/CO2 emission inventories of China and its 30 provinces from 1997 to 2015. The dataset will be updated and published annually. The energy inventories are collected from China’s official statistical documents, while the CO2 emissions are calculated based on the updated emission factors and most up to date energy consumption data. The emission inventories are constructed in a uniform format, which includes emissions from 17 fossil fuels burned in 47 socioeconomic sectors (energy-related emissions) and those from 7 industry production processes (process-related emissions). We also focus on city-level emission accounts in China. We develop a set of methods for constructing CO2 emissions inventories for generic Chinese cities based on energy balance tables. The city-level emission inventories have the uniform format with the national/provincial inventories. We applied the methods to 200+ Chinese cities and built the time-series CO2 emission inventories of the cities.
The uniformly formatted time-series emission inventories can be utilized widely. These inventories can provide robust data support for further analysis of China’s environmental issues and emissions reduction policy-making. For example, our latest studies based on CEADs data find that the global financial crisis has affected the drivers of China’s carbon emission growth. From 2007 to 2010, the CO2 emissions induced by China’s exports dropped, whereas emissions induced by capital formation grew rapidly.
In this ‘new normal’, the strongest factors that offset CO2 emissions have shifted from efficiency gains to structural upgrading. Efficiency was the strongest factor offsetting China’s CO2 emissions before 2010 but drove a 1.4% increase in emissions in the period 2010–2012. By contrast, production structure and consumption patterns caused a 2.6% and 1.3% decrease, respectively, in China’s carbon emissions from 2010 to 2012.
In addition, China tends to shift gradually from an investment to a consumption-driven economy. The proportion of CO2 emissions induced by consumption showed a declining trend before 2010 but grew from 28.6%–29.1% during 2010–2012. We also find that China’s CO2 emissions peaked in 2013 at a level of 9.53 Gigatons, and declined in each year 2014-2016 to 9.2 Gt CO2 in 2016 (a total decrease of 3.2%).
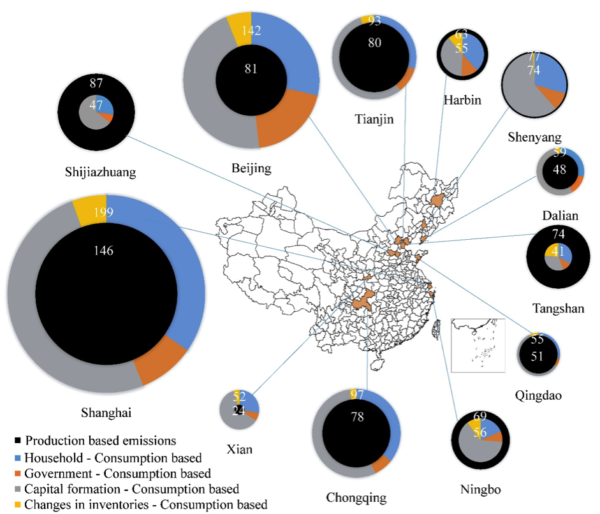
Based on input-output techniques, we calculate the consumption-based emission inventories for China, its provinces and cities as well. For example, in one of our recent papers, we calculate the consumption-based CO2 emissions for 13 Chinese cities and find substantial differences between production- and consumption-based accounting in terms of both overall and per capita carbon emissions. Urban consumption not only leads to carbon emissions within a city’s own boundaries but also induces emissions in other regions via interregional trade. In megacities, such as Shanghai, Beijing and Tianjin, approximately 70% of consumption-based emissions are imported from other regions.
All datasets published by CEADs are the results of current research projects funded by Research Council UK, Newton Fund, the National Natural Science Foundation of China, Chinese Academy of Sciences. All data is free to download for academic usage.
See our selected publications for more information:
- Liu, Z., D. Guan, W. Wei, S. J. Davis, P. Ciais, J. Bai, S. Peng, Q. Zhang, K. Hubacek and G. Marland (2015). “Reduced carbon emission estimates from fossil fuel combustion and cement production in China.” Nature 524(7565): 335-338.
- Shan, Y., D. Guan, J. Liu, Z. Mi, Z. Liu, J. Liu, H. Schroeder, B. Cai, Y. Chen and S. Shao (2017). “Methodology and applications of city level CO2 emission accounts in China.” Journal of Cleaner Production.
- Shan, Y., H. Zheng, D. Guan, C. Li, Z. Mi, J. Meng, H. Schroeder, J. Ma and Z. Ma (2017). “Energy consumption and CO2 emissions in Tibet and its cities in 2014.” Earth’s Future.
- Mi, Z., J. Meng, D. Guan, Y. Shan, Z. Liu, Y. Wang, K. Feng and Y.-M. Wei (2017). “Pattern changes in determinants of Chinese emissions.” Environmental Research Letters.
- Mi, Z., Y.-M. Wei, B. Wang, J. Meng, Z. Liu, Y. Shan, J. Liu and D. Guan (2017). “Socioeconomic impact assessment of China’s CO2 emissions peak prior to 2030.” Journal of Cleaner Production 142: 2227-2236.
- Meng, J., Z. Mi, H. Yang, Y. Shan, D. Guan and J. Liu (2017). “The consumption-based black carbon emissions of China’s megacities.” Journal of Cleaner Production.
- Mi, Z., Y. Zhang, D. Guan, Y. Shan, Z. Liu, R. Cong, X.-C. Yuan and Y.-M. Wei (2016). “Consumption-based emission accounting for Chinese cities.” Applied Energy 184: 1073-1081.
- Shan, Y., J. Liu, Z. Liu, X. Xu, S. Shao, P. Wang and D. Guan (2016). “New provincial CO2 emission inventories in China based on apparent energy consumption data and updated emission factors.” Applied Energy 184: 742-750.
- Shan, Y., Z. Liu and D. Guan (2016). “CO2 emissions from China’s lime industry.” Applied Energy 166: 245-252.